Visualization
Currently only one artist, the MatplotlibArtist, is provided by ProjectPredict. It provides a single visualization of a project based on its generated statistics using matplotlib. It places positions the tasks on a graph based on its mean latest start date, creating a timeline of the project. Additionally, it can shade the tasks based on either the total float, latest start, or earliest finish (the default colormap is Matplotlib’s Spectral colormap).
Note
The following example uses the Project developed using the learning model from Learned Model
1 2 3 4 5 6 7 8 | from projectpredict.artists import MatplotlibArtist
import matplotlib.pyplot as plt
artist = MatplotlibArtist(project)
current_time = datetime(year=2018, month=4, day=25)
fig, ax = artist.draw(current_time=current_time)
plt.tight_layout()
plt.savefig('myproject.png')
|
This results in the following plot:
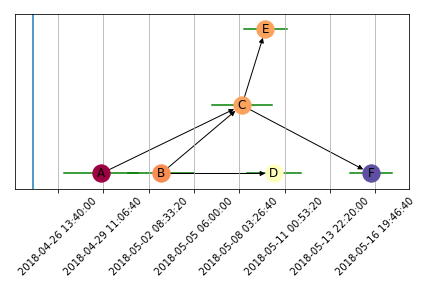
The horizontal bars indicate the standard deviation of the latest start date, and teh blue vertical bar represents the current date. These can be toggled off by setting the “show_variance=False” and “show_current_time=False” keyword arguments respectively.
Custom Visualizations
No interface must be satisfied to make your own visualizations, but an ArtistBase class has been provided which supplies a function, get_positions(), which generates a timeline-like graph of the project based on the latest start date for each task in the project. You can choose to extend from this base class or not.
Layout Algorithm
Constructing the visual layout of the Project is non trivial, and the current implementation still doesn’t get it quite right. Currently the algorithm iterates through the tasks in topological order,
find the optimal spacing for the tasks
initialize the position of the first task (in topological order) to be 0,0
for task in topological sort of project:
   x_position = task's latest start date
   relevant_positions = all previously-seen tasks such that their x-distance is <= the optimal distance
   if any of relevant_positions are predecessors of the current task:
      relevant_positions = the predecessors of the task which are in relevant_positions
   best_neighbor = the task in relevant_positions whose x-position difference from the current task is greatest
   y_position = y such that (x-position, y) is on a circle centered at best_neighbor with radius optimal_distance
   store x_position, y_position for the task
The optimal distance is rather arbitrarily found by
start_tasks = all tasks with no predecessors
terminal_tasks = all tasks with no successors
max_path = longest path between any start task and any terminal task
max_time_difference = (end of max_path's latest finish date - start of max path's latest finish date)
optimal_distance = max_time_difference / length of max_path